
In the highly competitive SaaS space, your organization’s success hinges upon your ability to understand, analyze and track business performance metrics and make fast business decisions in accordance with those metrics.
As such, it’s essential to capture SaaS metrics beyond basic GAAP reporting and ensure that you’re properly calculating and interpreting those metrics. However, to get the clearest picture of your business, and learn where you can optimize it to drive profit, you also want to take sales funnel metrics into consideration.
SaaS companies typically think of their sales pipeline as a funnel, visualizing the customer journey from initial brand awareness through conversion to closed deals. Understanding the dynamics of your inbound and outbound sales funnels and their corresponding metrics allows you to analyze each step of your sales process to determine what’s working, what’s not working and what can be adjusted to produce better outcomes. This gives you actionable insights to effectively propel your sales strategies from the top of the funnel all the way through the finish line.
We typically look at two types of funnels that correspond with each respective sales strategy: inbound and outbound. A SaaS inbound sales funnel looks at a customer journey that begins with the prospective client reaching out to your organization about your product or service.
The below graphic shows the structure of an inbound sales funnel:
Marketing Spend → Demand Generated → Demos Requested → New Customer Bookings
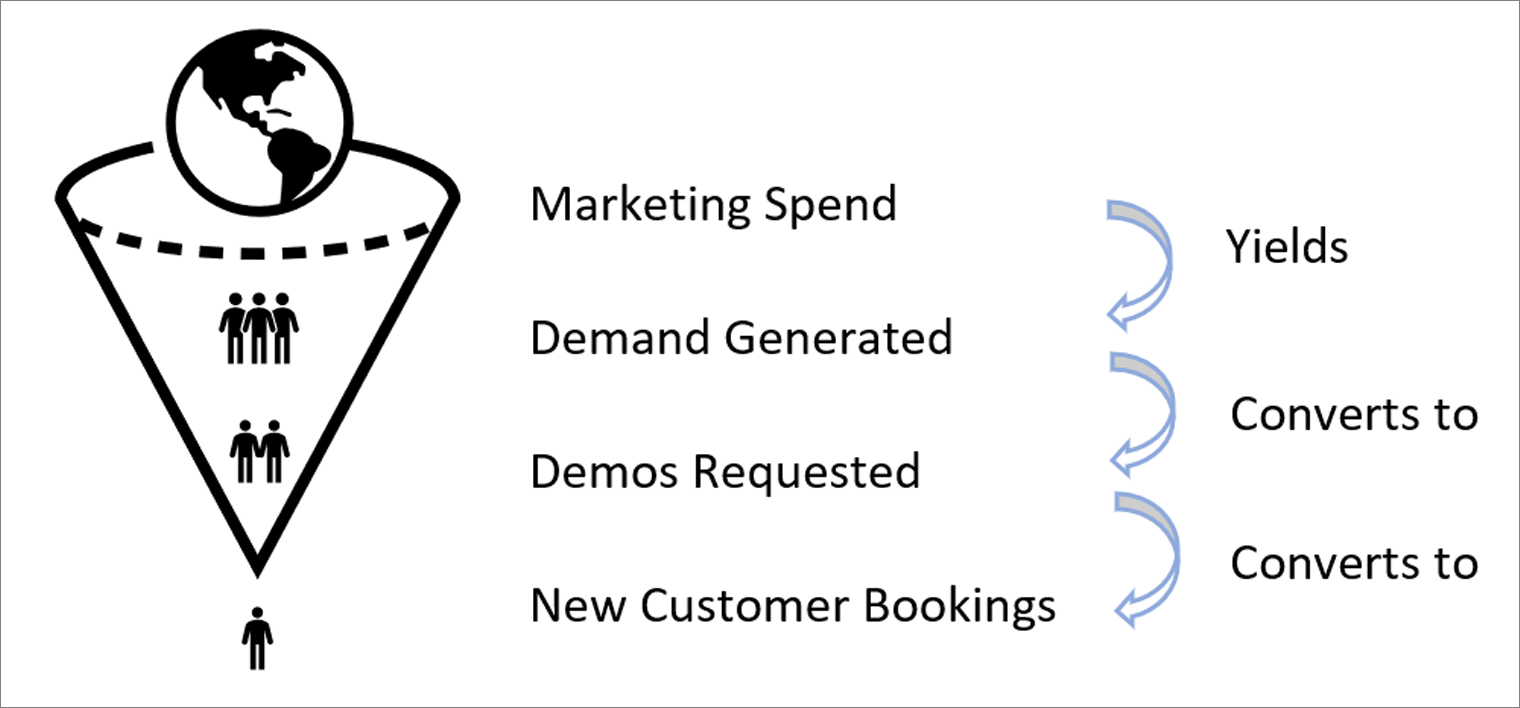
At the start of your inbound sales funnel, some amount of marketing spend is devoted to acquiring lead sources that generate demand for your services (e.g., a paid Google ad drives traffic to your website, which is measured in clicks).
Then, some portion of this initial demand converts to prospective customers who request a demo of the product. At this stage, we can calculate our conversion rate, i.e., the percentage of prospective customers who move down the funnel from one stage to the next. Each step of the funnel has its own conversion rate worth tracking:
Conversion Rate (Click-to-Demo) = Prospects Requesting Demos ÷ Ad Clicks
Finally, some portion of these prospects will decide to sign up for the service. At this point, we are left with our new customers whose contracts represent our new customer bookings. Framing this within our growth equation, the sum of the ARR generated from these new customers represents the inbound portion of our total New ARR.
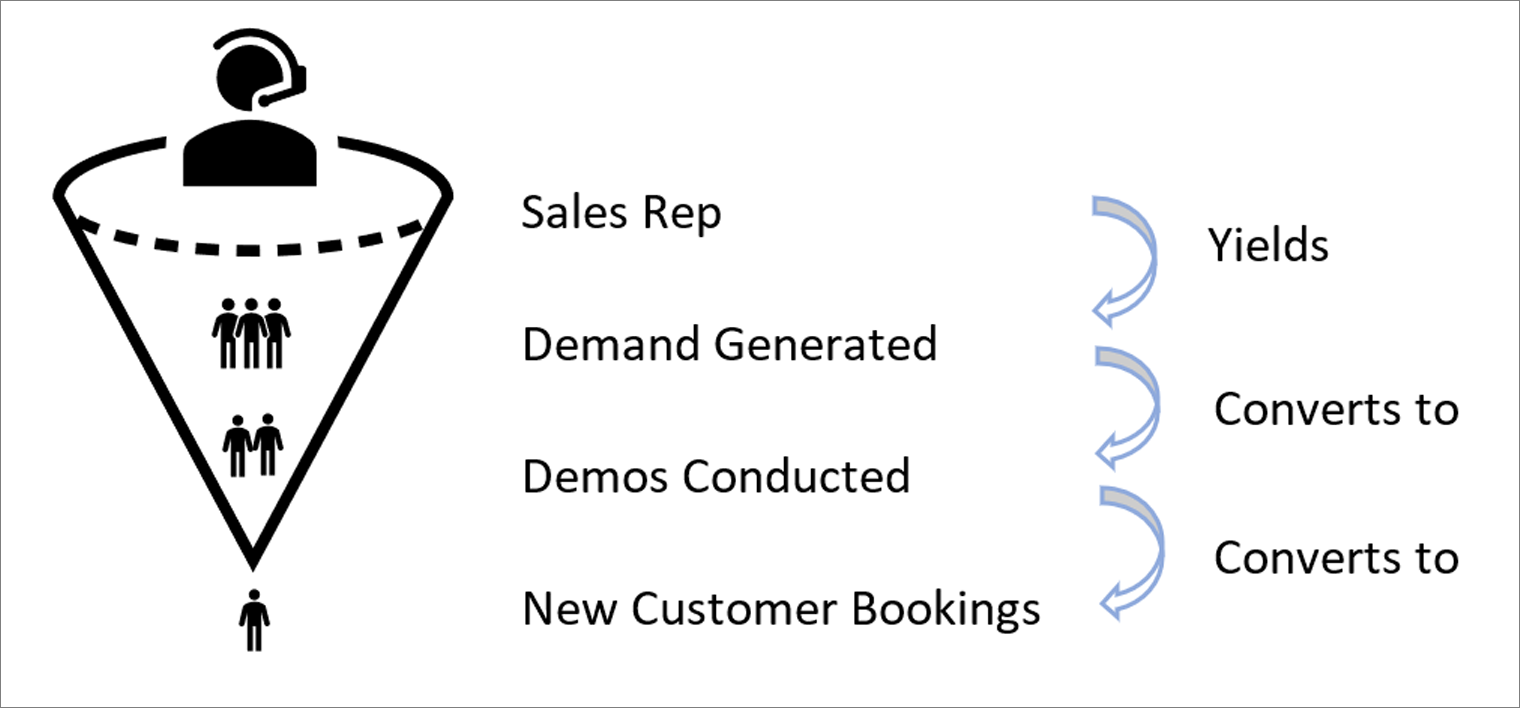
An outbound sales funnel looks at a customer’s journey, starting with outreach from a sales representative. It differs from an inbound funnel in two key ways:
As you can see in the below graphic, the outbound sales funnel has a similar structure to the inbound funnel. Just like our inbound funnel, the sum of these new customers’ ARR represents the outbound portion of our total New ARR.
Sales Rep → Demand Generated → Demos Conducted → New Customer Bookings
To optimize your sales funnels, it is important to examine the inner workings of your lead sources by measuring their respective funnel metrics. These metrics include the number of prospects at each stage, the conversion rates between stages, and the time it takes for customers to move through the funnel stages, i.e., conversion speed.
Tracking these metrics reveals how well a given lead source generates demand, any conversion-inhibiting bottlenecks that are preventing more sales, and the length of time it takes on average for customers, by cohort and by each reportable data element, to progress through the funnel
If a lead source is not generating enough traffic, we could seek to improve its attractiveness with better content or rebalance our utilization of lead sources to favor more attractive ones.
If through the course of funnel analysis, we identify low conversion between any steps, we could target specific improvements to those bottlenecks by assessing the reasons for low conversion (e.g., unnecessary friction, lack of trust preventing customers from giving away personal information, subpar sales training, etc.).
Knowing our customers’ conversion speed adds crucial insight into how long it takes marketing spend to turn into sales. Measuring this at each step of the funnel highlights areas where friction may be impacting our sales efficiency, indicated by slow conversion speeds. This is also an important consideration when forecasting sales and cash flows.
When evaluating the productivity of our outbound sales representatives, in addition to establishing clear measures of employee performance, we also learn our requirements for future growth. For instance, if we want to increase our outbound team’s New ARR next year, and we know the average productivity per rep (PPR) across our outbound sales representatives as measured by Total New ARR ÷ Total Outbound Sales Reps, then all we need to do is divide our ARR target by our PPR to arrive at the headcount needed to achieve the target. (Note: In practice, it is important to consider the onboarding time it takes for a new hire to achieve full sales effectiveness when forecasting growth and headcount.)
Customer sentiment, the emotions your prospects feel as they interact with your brand, and customer engagement, the ongoing interactions between your business and its customers, are the leading indicators of expansion and churn. There are various ways to measure customer sentiment and customer engagement, including surveys, usage tracking metrics and customer support usage.
Surveys are an insightful source of customer sentiment. Three excellent survey-borne measures of customer sentiment include net promoter score, customer satisfaction score and customer effort score.
As arguably the most widely used measurement of customer sentiment, this score reflects general company reputation and the likelihood of word-of-mouth recommendations.
In addition to survey metrics, usage tracking metrics embedded in the solution can reveal a great deal of insight into the customer experience. A popular use case for these metrics is quantifying customer engagement. By assigning “grades” to touchpoints, with touchpoints indicative of higher engagement earning higher grades, we can quantify the engagement of any given user with precision based on which touchpoints they interact with. In addition, we can measure the amount of time they spend in the solution as a proxy for their commitment to the service. These strategies provide real-time feedback and do not require any effort on behalf of the customer.
Lastly, it is insightful to track customer support usage, measured by the number, type and frequency of customer support requests. Measuring these data points can reveal where the product presents difficulties for users. It also allows the business to monitor the quality of its customer support staff, a critical factor in customer retention.
Using SaaS sales funnel metrics can provide unique insights into your organization and its customer purchasing journey. By tracking and analyzing your sales funnel metrics, you can better pinpoint the strengths and weaknesses of your organization’s buying process, identify opportunities for growth, and obtain bottom-line benefits that will help you better generate sustained success.
To learn more about making sure your SaaS company has the right processes, tools and resources to be successful, contact our experts.